
Let’s just get right to it – we are NOT on the verge of a housing crash.
Don’t believe us? That’s OK – we get it. We’re on the internet (clearly), and we watch the videos and see the headlines that are being thrown in your face everyday:
- Economist who called 2008 housing crash predicts another 15% drop in home prices – Fox Business
- Housing Market Crash: 20% Drop Coming to High-Priced Cities – Business Insider
- Housing Market Crash Fears After Prices Fall for Fifth Month in a Row – Newsweek
We understand it’s hard to tune out the noise and figure out who and what to believe. Which is why we want to make it easier for you with one of our favorite things – DATA!
The charts below are some of the reasons why we know that the housing market is not in danger of a crash. They paint a clear picture of where home supply and demand are now, and help us forecast where they are heading this year so we can predict how home values will hold up.
Let’s get into it!
Chart #1: Inflation and Mortgage Rates
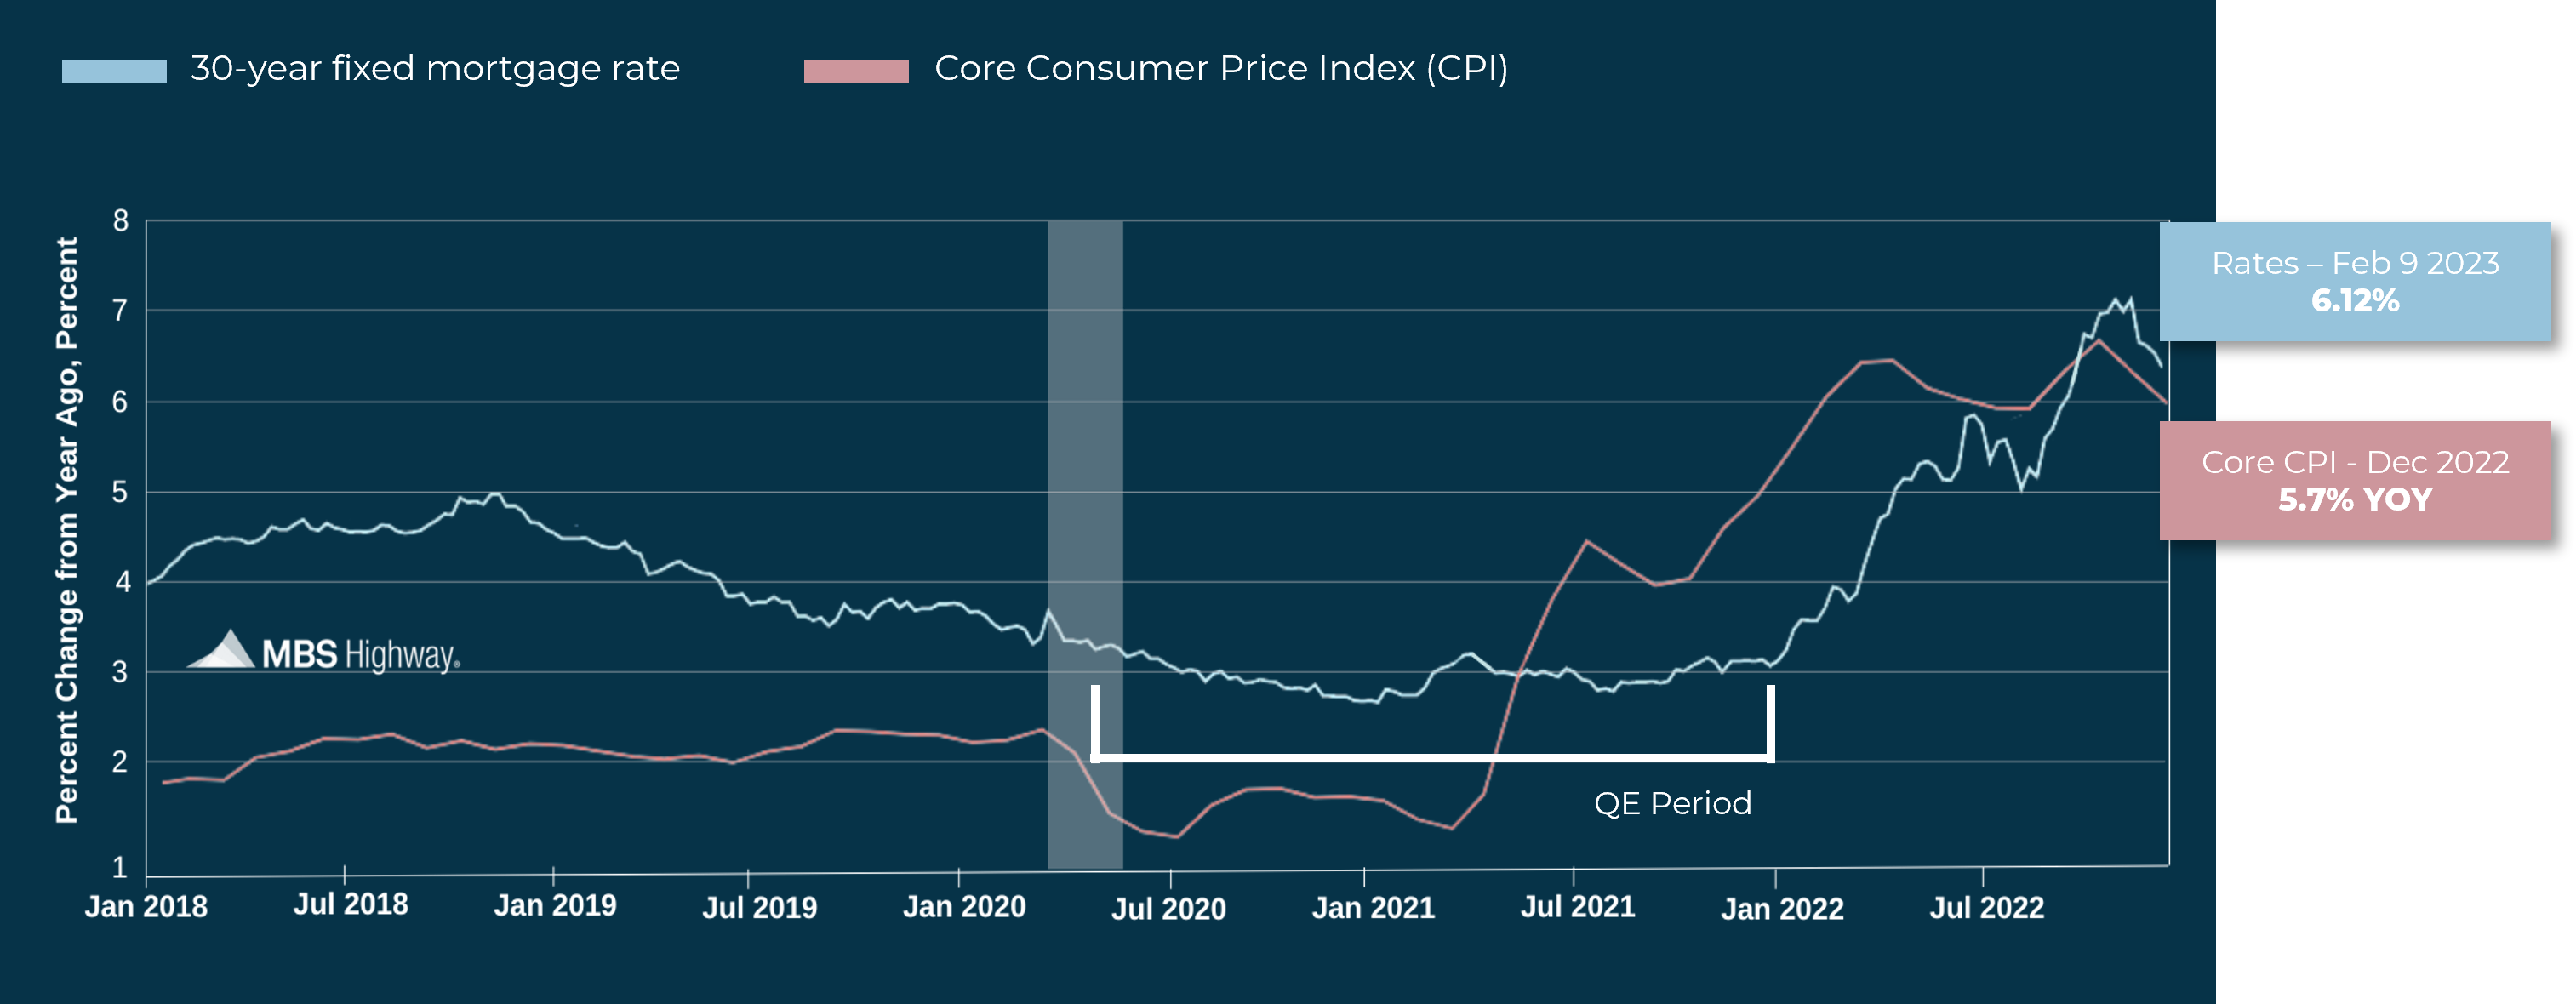
The pink line in the graph above shows inflation (CPI) and the blue shows the history of 30-year fixed mortgage rates. Historically, mortgage rates rise as inflation rises and fall as inflation falls.
But when inflation started skyrocketing in the Spring of 2021, mortgage rates remained low thanks to the Federal Reserve’s continued buying of mortgage bonds (quantitative easing). Once the Fed stopped buying these bonds, rates started to creep up and follow inflation again. And now that inflation is coming down, mortgage rates are following suit.
Why does this matter? Lower rates will make housing more affordable for millions of Americans.
The demand for homes is there – it’s just been obstructed because of high rates. We’ve already seen demand start to increase, and it will only go higher as mortgage rates continue to fall in response to inflation.
But how do we know that inflation will continue to fall?
Chart #2: Inflation and Money Supply
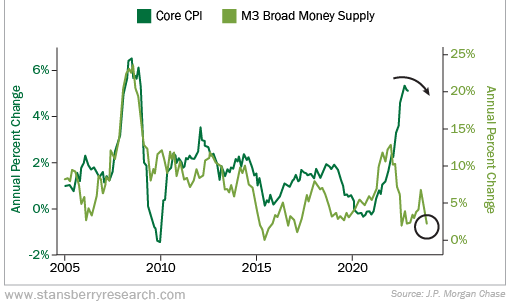
One way we can look at where inflation is heading is by looking at the money supply in the economy.
When more money is circulating in the economy, more dollars are chasing the same goods and services – which drives up prices. You can see in the chart above from Stansberry Research how the Core Consumer Price Index (CPI) tends to move in tandem with the money supply.
Why does this matter? Given the recent downturn in money supply, it makes sense inflation will follow suit. This means mortgage rates should continue to fall and make housing more affordable.
“But homes prices are still so high! Will lower rates really make that much of a difference?”
Chart #3: Change in Annual Income
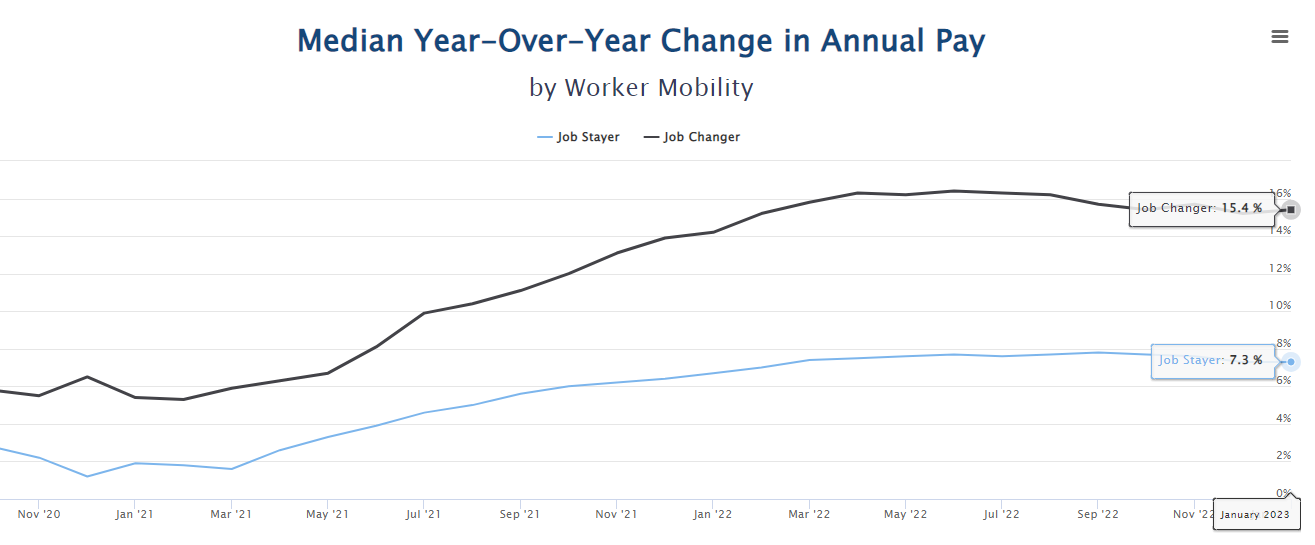
According to ADP, those who stayed at their jobs saw a median income increase of 7.3% in January compared to the same time last year. Those who switched jobs saw an increase of 15.4%.
Why does this matter? Lower interest rates are not the only thing making housing more affordable. In some cases, the extra money from these income increases actually outpace the increased housing costs associated with higher mortgage rates. As housing continues to become more affordable, more people will want to buy homes.
But are there enough homes available for sale to soak up this higher demand? Let’s find out.
Chart #4: Existing Homes for Sale and Rental Vacancy Rates
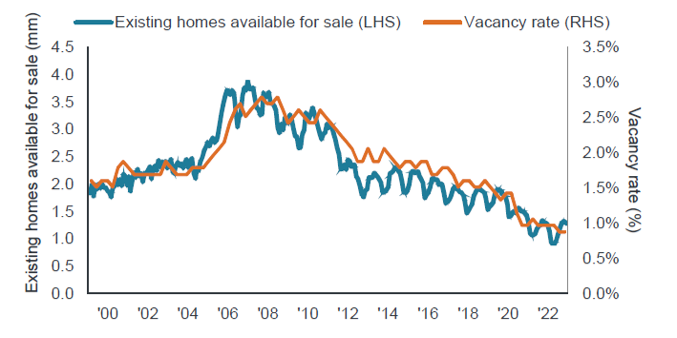
During and leading up to the last housing crash, homes available for sale and vacancy rates of rental properties skyrocketed. This surplus of supply was a big reason why homes values fell after 2008.
But look where we are today. Available homes for sale and rental vacancy rates are the lowest they’ve been in over 20 years. The most recent data from NAR shows that total housing inventory at the end of December 2022 was only 970,000.
Why does this matter? We are already in an environment where available housing is the lowest it’s been in years. There is not enough supply to meet the current demand, let alone the new demand that will continue to hit the market as mortgage rates further their decline.
“OK, so supply is low NOW, but won’t it increase as we enter into the busy Summer homebuying season?”
Chart #5: Mortgage Rates of Currently Outstanding Loans
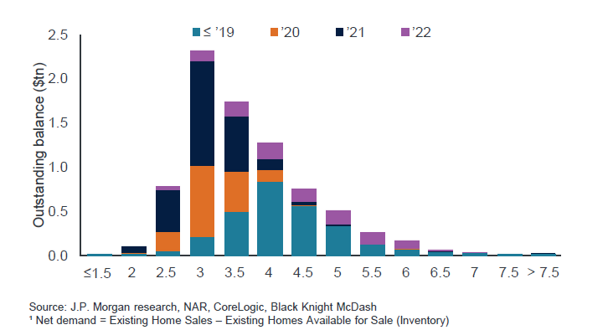
According to data from J.P. Morgan research, NAR, CoreLogic, and Black Knight, 80% of the outstanding mortgage balances in the U.S. have an interest rate below 4%.
Why does this matter? These homeowners aren’t going anywhere. Even with interest rates coming down to nearly 6%, it’s hard to imagine that those with sub-4% mortgages are going to be chomping at the bit to put their homes on the market.
This is what is keeping home inventory so tight. And on top of that, rents are increasing. Even if these homeowners decide to move, their low monthly mortgage payments mean they can turn their homes into rental properties, cover their mortgage payment, and probably earn a little extra to offset the higher cost of their new home.
The Bottom Line
Tune out the nonsense you hear in the media about housing – we are NOT on the verge of another housing crash.
As home affordability improves, we are going to see new demand unleashed into a market with already low supply. As a result, we expect the housing market to remain stable and for homes values to appreciate at a more moderate level this year.
We are confident that the housing market will remain steady in 2023 and beyond, and that real estate will continue to be a safe investment and a great way to build wealth.